
Instructions:
For facility operators and quality assurance leaders, ATP (adenosine triphosphate) monitoring is one of the most powerful tools available. It provides a near-instant, quantitative measure of cleaning effectiveness, replacing subjective visual checks with objective, scientific data. But like any powerful tool, its data is only as reliable as the process used to collect it.
A critical but often-overlooked pitfall can undermine the entire system: disinfectant quenching. This phenomenon can create “false low” readings, leading to a dangerous and unfounded sense of security. Understanding this challenge—and implementing robust controls to mitigate it—is the difference between data that drives good decisions and data that masks hidden risks.
What ATP Measures (And What It Doesn’t)
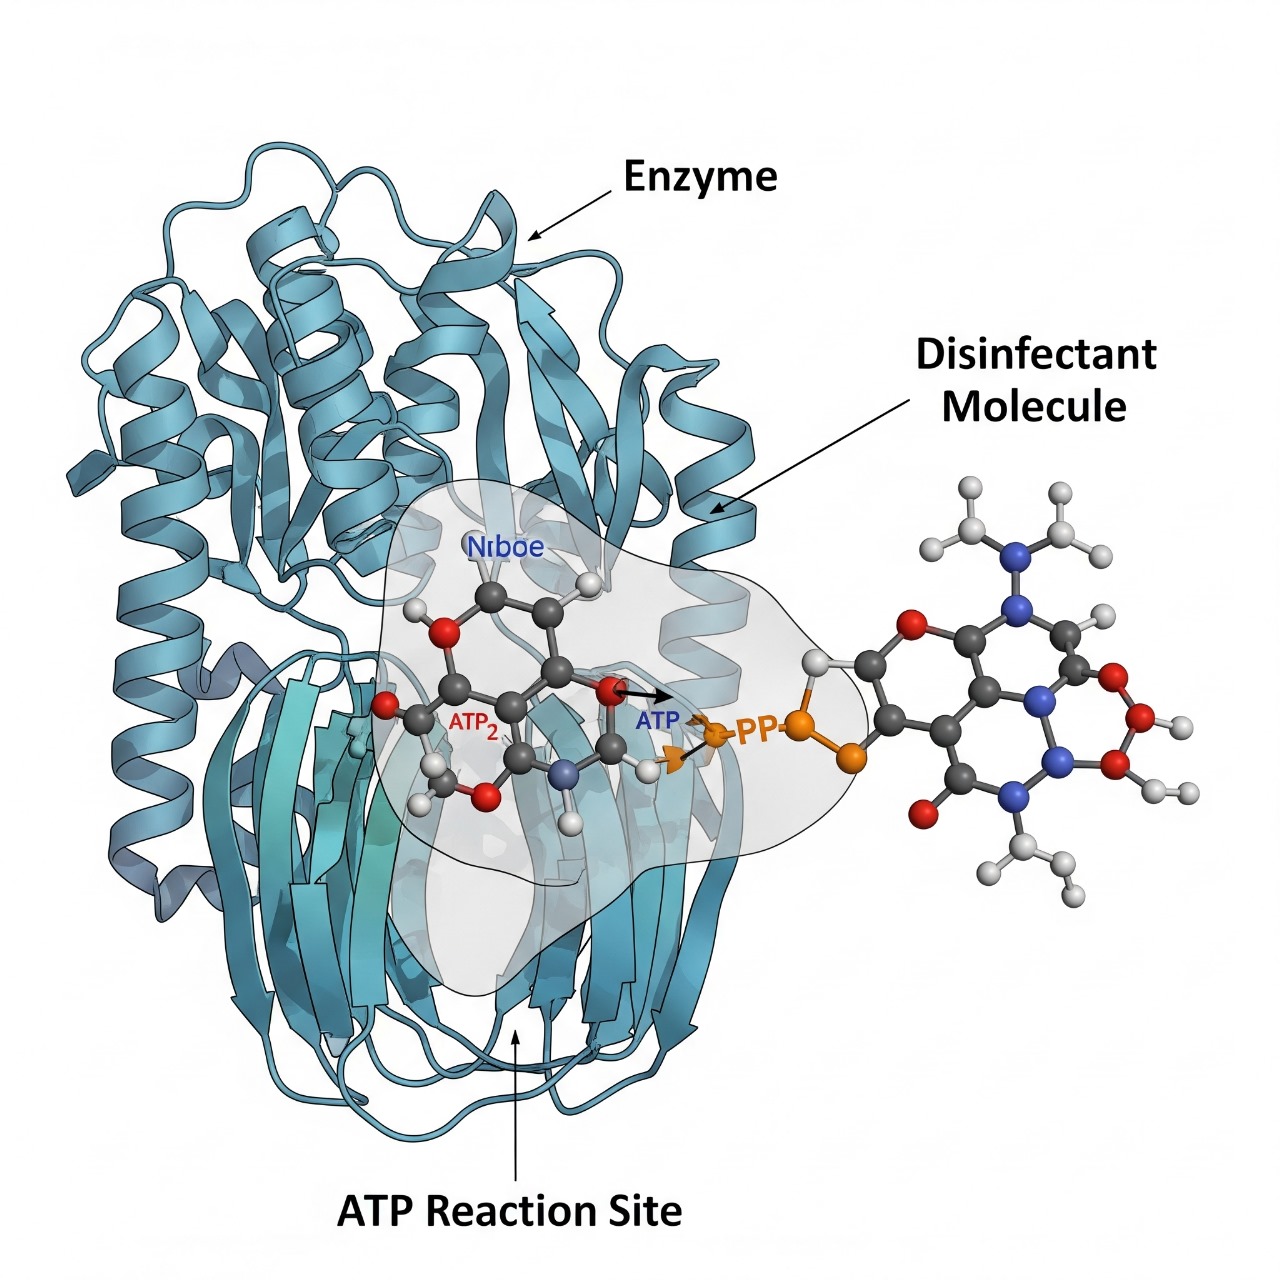
First, a quick primer on the science. ATP is an energy-carrying molecule found in all living or once-living cells, from bacteria and mold to food residue and human skin cells. An ATP monitoring system uses a swab to collect a sample from a surface. This swab is then exposed to the enzyme luciferase (the same enzyme that makes fireflies glow).
If ATP is present, it fuels a reaction that produces light. A handheld device called a luminometer measures this light and reports it in Relative Light Units (RLU).
- What it measures: The total amount of biological material on a surface. It is a direct indicator of overall cleanliness.
- What it doesn’t measure: It is not a diagnostic tool. It cannot identify specific pathogens like Norovirus or difficile. It simply tells you if a surface has been cleaned effectively enough to remove the organic matter that harmful microbes thrive in.
A low RLU score is a strong indicator of a clean surface. A high score signals that the cleaning process failed, leaving behind a foundation for potential contamination.
The Hidden Threat: “Quenching” and False Low Readings
The bioluminescence reaction is a delicate enzymatic process. Unfortunately, the very chemicals we use to disinfect can interfere with it. This interference is called “quenching”.
Certain disinfectant residues left on a surface can inhibit or damage the luciferase enzyme, suppressing its ability to react with ATP and produce light. The result is an RLU reading that is artificially and inaccurately low. You might get a “pass” reading of 15 RLU, but the true microbial load could be dangerously high, equivalent to a “fail” score of 200 RLU.
This creates a false sense of security and can lead to terrible decisions, like clearing a room for occupancy when it is still a transmission risk. While many chemistries can cause some interference, common culprits known to cause significant quenching include peracetic acid (PAA), certain quaternary ammonium compounds (“quats”), and chlorine-based disinfectants, especially at high concentrations.
Building a Trustworthy System: Controls Are Non-Negotiable
To ensure your ATP data is decision-grade, you must build a system of controls to proactively mitigate the risk of quenching. This is a core component of Theorem Guard’s multi-layered mitigation strategy.
Control 1: Neutralizing Swabs
The first and most important line of defense is using the right tool. High-quality ATP swabs often contain a neutralizing buffer in the wetting agent. This specialized chemistry is designed to counteract the inhibitory effects of common disinfectant residues, “un-quenching” the reaction and allowing for a more accurate measurement of the true microbial load. Using a non-neutralizing swab on a recently disinfected surface is a recipe for unreliable data.
Control 2: Baseline Controls and Field Blanks
Data needs context. Before starting a monitoring program, establish baseline readings on designated control surfaces that are not subjected to disinfection. This helps you understand the natural bio-load of your environment and helps differentiate between a truly clean surface and one where the reading may be affected by chemical interference. Additionally, incorporate field blanks into your routine: activate a new swab without swabbing any surface. The reading should be 0 (or very close to it). A result higher than 0 could indicate contamination of the swabs themselves.
Control 3: Duplicates and Trending
A single data point can be an anomaly; a trend is information. When you get an unexpected reading (either very high or surprisingly low), take a duplicate sample from an adjacent area to confirm the result. More importantly, focus on trending data over time. A sudden, facility-wide drop in RLU scores that doesn’t correlate with a change in cleaning protocols could be a red flag for a new disinfectant causing a quenching issue.
The Next Level: AI-Powered Anomaly Detection
Manually tracking trends across dozens of locations and hundreds of data points is difficult. This is where technology provides a crucial advantage. The Theorem AI engine is trained on historical data from thousands of surfaces. It models the expected ATP decay curve for different materials and environments after a successful cleaning.
The algorithm automatically flags statistically significant deviations from this expected curve. If a surface that typically reads around 25 RLU post-cleaning suddenly starts reading 5 RLU across the board, the system can flag this as a potential quenching event and trigger a protocol for re-testing and verification. This automates the process of catching outliers and ensures data integrity at scale.
Sample ATP Testing Runbook
- Identify: Select today’s 10 pre-defined high-touch testing locations from the plan.
- Calibrate: Turn on the luminometer and run the self-calibration check.
- Prepare: Remove a neutralizing swab from its tube. Do not touch the tip.
- Sample: Firmly rub the swab tip over a standard 4×4 inch area, applying even pressure. Swab vertically, horizontally, and diagonally.
- Activate: Return the swab to its tube, break the snap-valve to release the reagent, and shake gently for 5 seconds.
- Measure: Insert the tube into the luminometer and press “Read.” Record the RLU score, location, time, and technician ID.
- Analyze: Compare the RLU score to the established pass/caution/fail thresholds (e.g., < 30 Pass, 30-99 Caution, > 100 Fail).
- Act: If “Fail,” trigger the re-cleaning and re-testing protocol. If “Caution,” log for trend analysis. If the result is unexpectedly low, take a duplicate sample.
Interpreting Pass/Fail Thresholds Responsibly
It’s tempting to treat pass/fail RLU thresholds as gospel. While they are essential for daily operations, it’s critical to use them responsibly. A single “pass” is not a lifetime guarantee of safety. A single “fail” is not a crisis, but an opportunity to retrain and improve.
The true power of ATP data comes from analyzing trends in the context of your specific risks. A rising trend in a daycare’s eating area ahead of norovirus season is a critical leading indicator that requires immediate attention. A consistently low trend after implementing a new staff training program is proof of its ROI.
ATP monitoring is a powerful ally in the quest for environmental health security. By understanding its limitations and proactively building in controls to ensure data integrity, you can move beyond hygiene theater and make decisions based on scientific proof.
Review Our Evidence-Based Protocols
https://theoremguard.ai/solutions/
Request a Protocol Review
https://theoremguard.ai/contact/?intent=advisory